Project Genesis1: I Built a 4-Node Kubernetes Cluster on Bare Metal. Here’s What I Learned. At work, we provision managed Kubernetes clusters. Click a button, get a cluster. Everything abstracted. Everything handled. At home? I built every piece myself. Two control planes. Two workers. GitOps pipeline. Monitoring stack. The blog you’re reading right now? It’s running on this infrastructure. Why build it? To prove to myself I understand what’s underneath the abstraction. To own the gaps instead of hiding them. To build the kind of operational depth that doesn’t come from any exam. This is Project Genesis1. And you’re standing on it.
The Abstraction Problem When you use a managed service or cloud provider, everything is abstracted away. You interact with the cluster, but you don’t know what’s going on underneath. You get the whole picture without knowing what it took to get there. Going bare metal forces you to deal with constraints. You bootstrap every component yourself — the API server, the scheduler, the controller manager, etcd. You configure networking. You handle storage. You see how the pieces actually fit together. It’s like putting a puzzle together piece by piece versus getting the completed puzzle handed to you. After passing CKA in January, I wanted to go deeper. The exam taught me how to USE Kubernetes. It didn’t teach me how to BUILD it. How to troubleshoot when BGP peering fails. How to debug redirect loops between Cloudflare and ArgoCD. How to make a cluster survive when you move apartments. I needed operational depth. The kind you only get by breaking things and fixing them yourself.
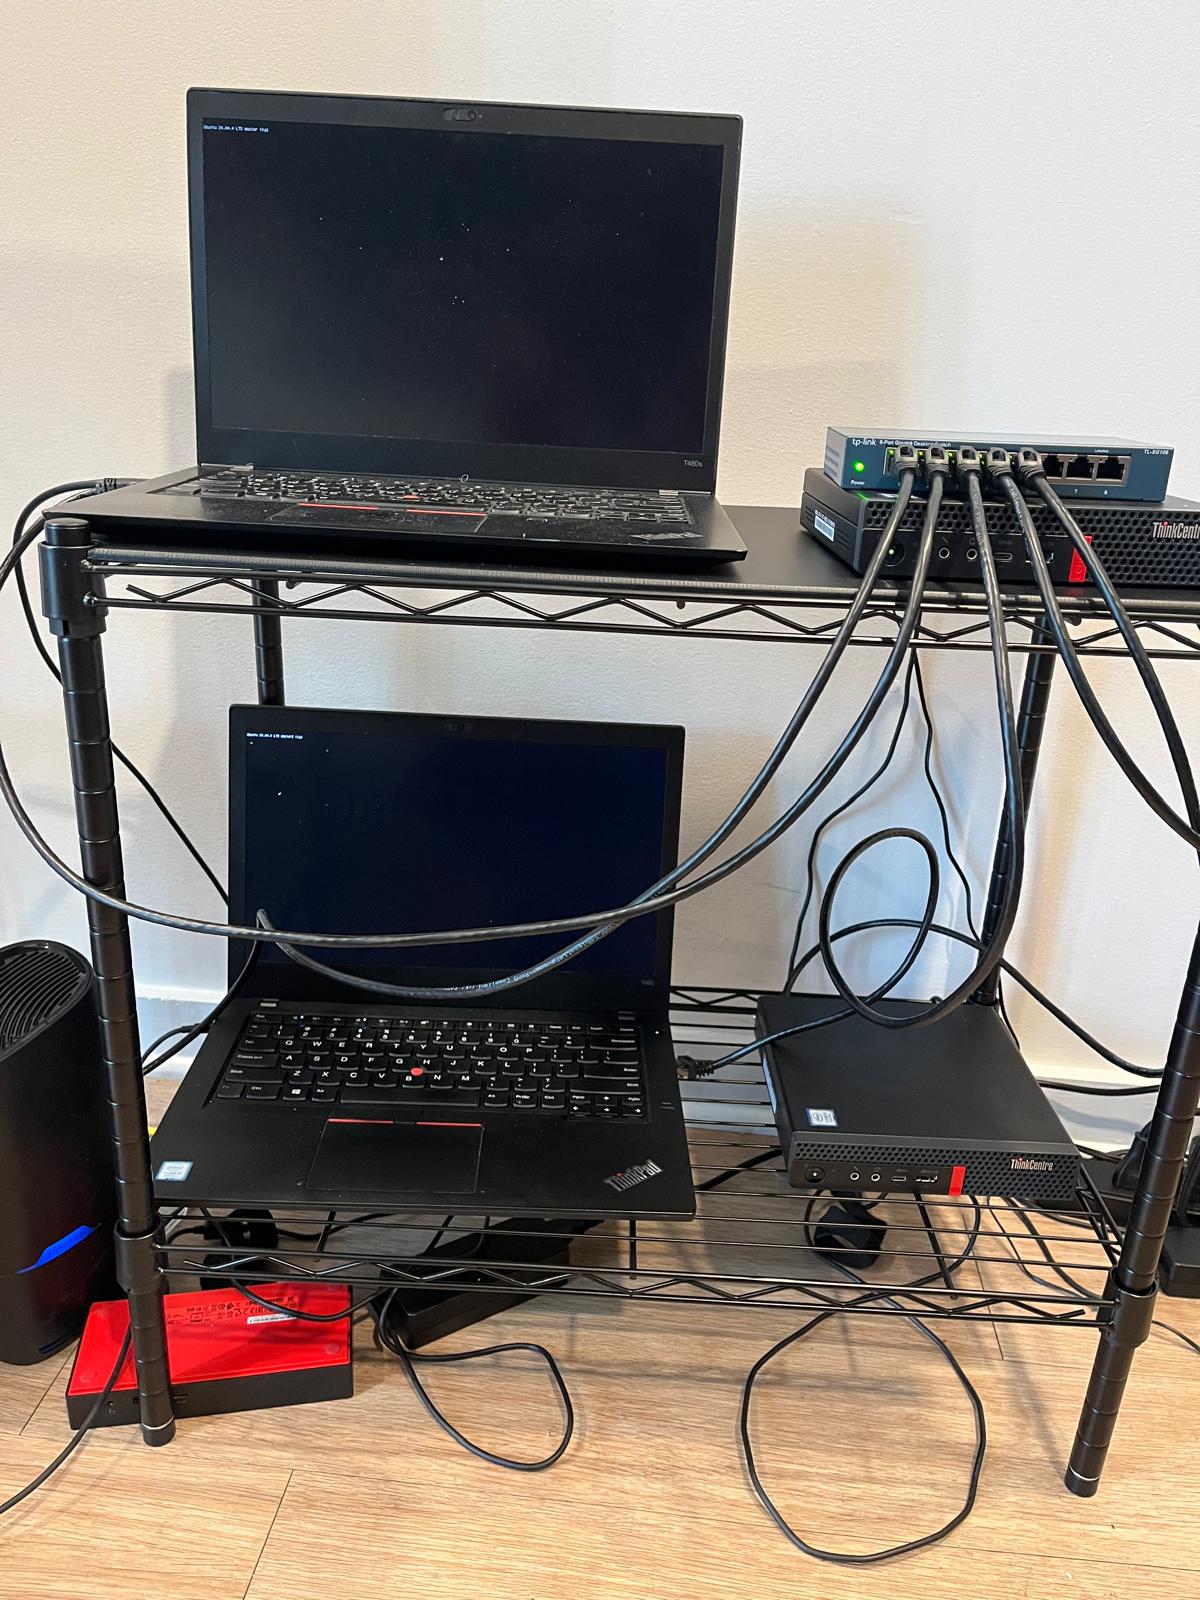
The Hardware
The idea evolved over a year. It started with Mischa van den Burg’s YouTube videos about building clusters from old hardware. Then it became two ThinkPads as control planes and Raspberry Pis as workers. Then Dell minis. Then, when budget constraints hit, Lenovo ThinkCentre M720q tiny desktops. The final setup: Two Lenovo ThinkPad T480s as control planes for high availability. Two ThinkCentre M720q tiny desktops as workers — 16GB RAM each, 32GB total across workers. All connected via Tailscale mesh network. Tailscale solved a critical problem. I’m moving apartments in June — different location, different router, different IP addresses. If I hardcoded home network IPs into the cluster configuration, the move would break everything. I’d have to rebuild from scratch. Tailscale assigns static IPs that never change. The cluster uses Tailscale IPs for all internal communication. When I move, the home network IPs change, but the Tailscale IPs stay the same. The cluster doesn’t even notice.
The Build
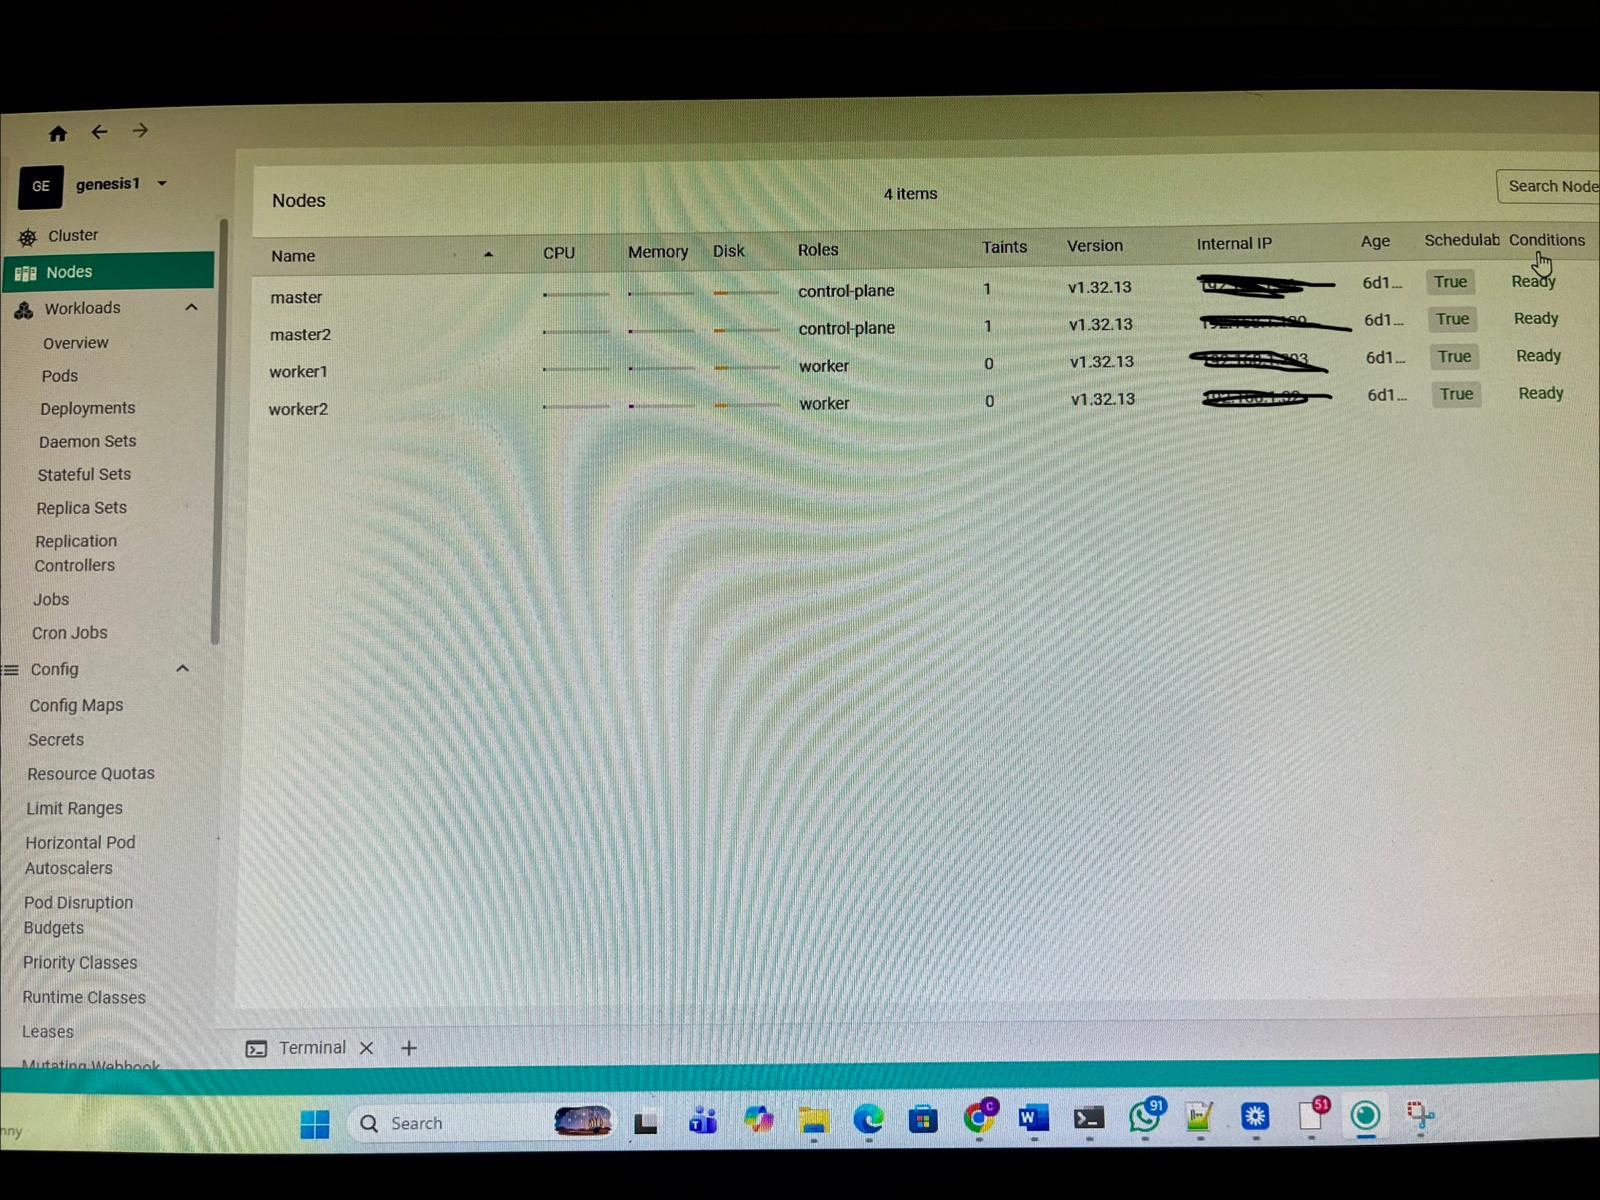 All 4 nodes Ready. master and master2 as control planes, worker1 and worker2 as workers. v1.32.13.
I ran kubeadm init on the first control plane. Joined the second control plane for HA. Joined both workers. Installed Calico for pod networking. Then things broke. The Calico/Tailscale conflict: Pods on worker nodes couldn’t reach the Kubernetes API server. MetalLB kept crashing with dial tcp 10.96.0.1:443: i/o timeout errors. The problem? Calico uses BGP to advertise pod network routes between nodes. When Calico auto-detected IP addresses, it picked up the Tailscale interface instead of the ethernet interface. Tailscale doesn’t support BGP peering. The pod network routes were never established. I diagnosed it by checking the Calico logs: Using autodetected IPv4 address on interface tailscale0. The fix required two steps. First, tell Calico which interface to use: bashkubectl set env daemonset/calico-node -n kube-system IP_AUTODETECTION_METHOD=interface=eno1,enp0s31f6 Second, patch each worker node’s BGP address using calicoctl to replace the Tailscale IPs with the home network IPs. Both steps required — one without the other is incomplete. This is the kind of issue you never encounter in managed Kubernetes. And it’s exactly why I built this. The ArgoCD redirect loop: After deploying ArgoCD and exposing it through Cloudflare Tunnel, visiting argocd.beyondthecert.dev threw ERR_TOO_MANY_REDIRECTS. ArgoCD’s server forces HTTPS by default — any HTTP request gets a 301 redirect to HTTPS. Cloudflare was set to Full SSL mode, which expects HTTPS from the origin server and also redirects HTTP to HTTPS. Infinite loop. The browser kept bouncing between Cloudflare and ArgoCD, each one redirecting to the other. The fix: disable HTTPS enforcement on the ArgoCD server by patching the ConfigMap with server.insecure: “true”. Then change Cloudflare’s SSL mode from Full to Flexible. Flexible means Cloudflare handles HTTPS with visitors but connects to the origin over HTTP. Loop broken. After five days of building and debugging, everything clicked. ArgoCD watching GitHub. Prometheus scraping metrics. Grafana dashboards showing real-time cluster state. Loki collecting logs from every pod on every node. This blog deployed via GitOps. Then I cordoned all four nodes and unplugged the network switch to organize cables. Everything came back. That’s when I stopped being scared of my own cluster. The final stack: ComponentPurposeKubernetesOrchestrationCalicoPod networkingMetalLBLoad balancingNginx IngressTraffic routingcert-managerTLS automationArgoCDGitOpsPrometheus + GrafanaMonitoringLokiCentralized loggingSealed SecretsEncrypted secretsCloudflare TunnelPublic accessTailscaleRemote SSHHugo + GitHub ActionsBlog + CI/CD
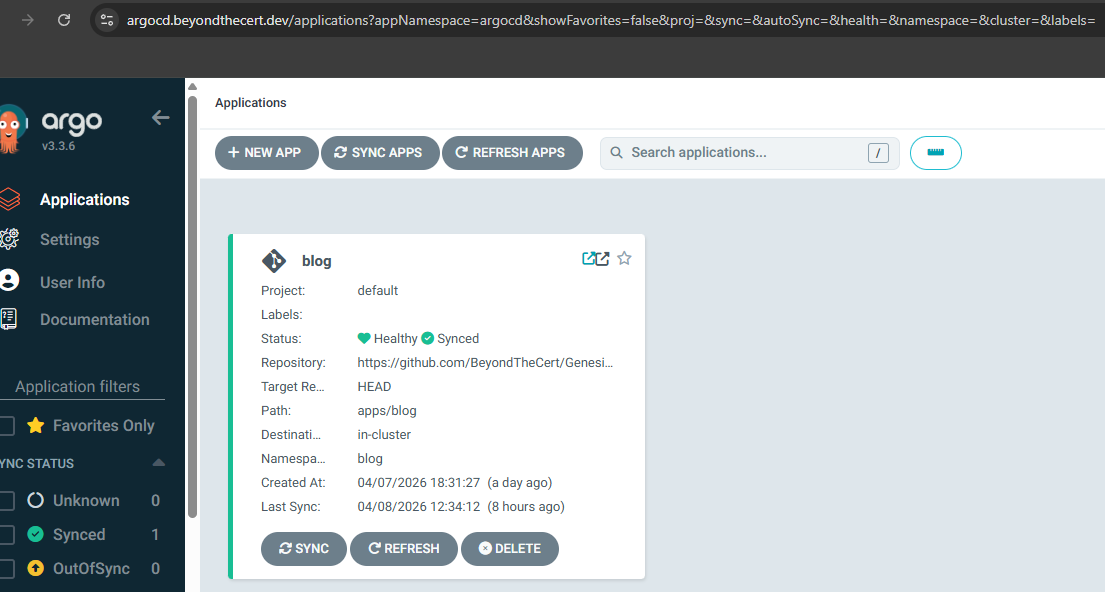 ArgoCD watching Genesis1-GitOps on GitHub. Push markdown, blog updates automatically.
Write a markdown file. Git push. GitHub Actions builds a Docker image. ArgoCD syncs the new image. The blog updates automatically.
What It Teaches
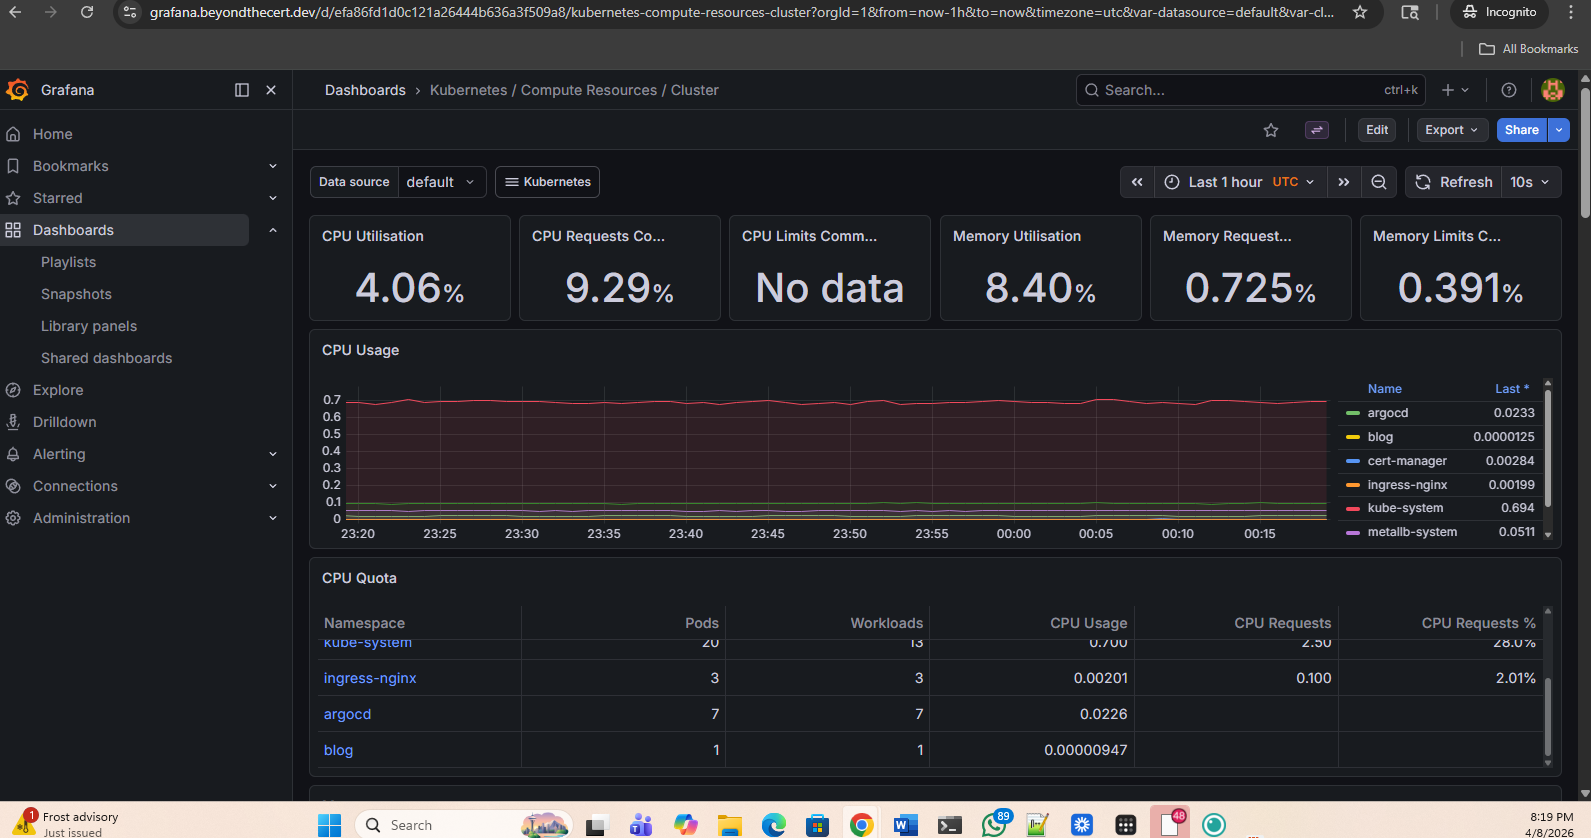 Real-time cluster metrics. CPU, memory, pod counts across all namespaces.
CKA taught me kubectl commands and how to troubleshoot pods. It didn’t teach me how Calico’s BGP peering works. It didn’t teach me Cloudflare’s SSL modes. It didn’t teach me that Tailscale and Calico conflict. You learn those things by running workloads on infrastructure you built. By debugging when something breaks at midnight. By reading logs until you find the one line that reveals the issue. That’s the operational depth that comes after the cert. And it’s not in any exam. I expected the build to take weeks, maybe a month or two. It took five days. kubeadm automates what Kubernetes the Hard Way made me do manually — certificate generation, component configuration, static pod manifests. But the debugging? That took longer than the build itself.
A Note On This Site
This blog isn’t hosted on Vercel or Netlify or GitHub Pages. It’s a pod running on worker nodes in my apartment. When you visit beyondthecert.dev, you’re hitting nginx pods on my workers, routed through Cloudflare Tunnel, deployed by ArgoCD watching GitHub.
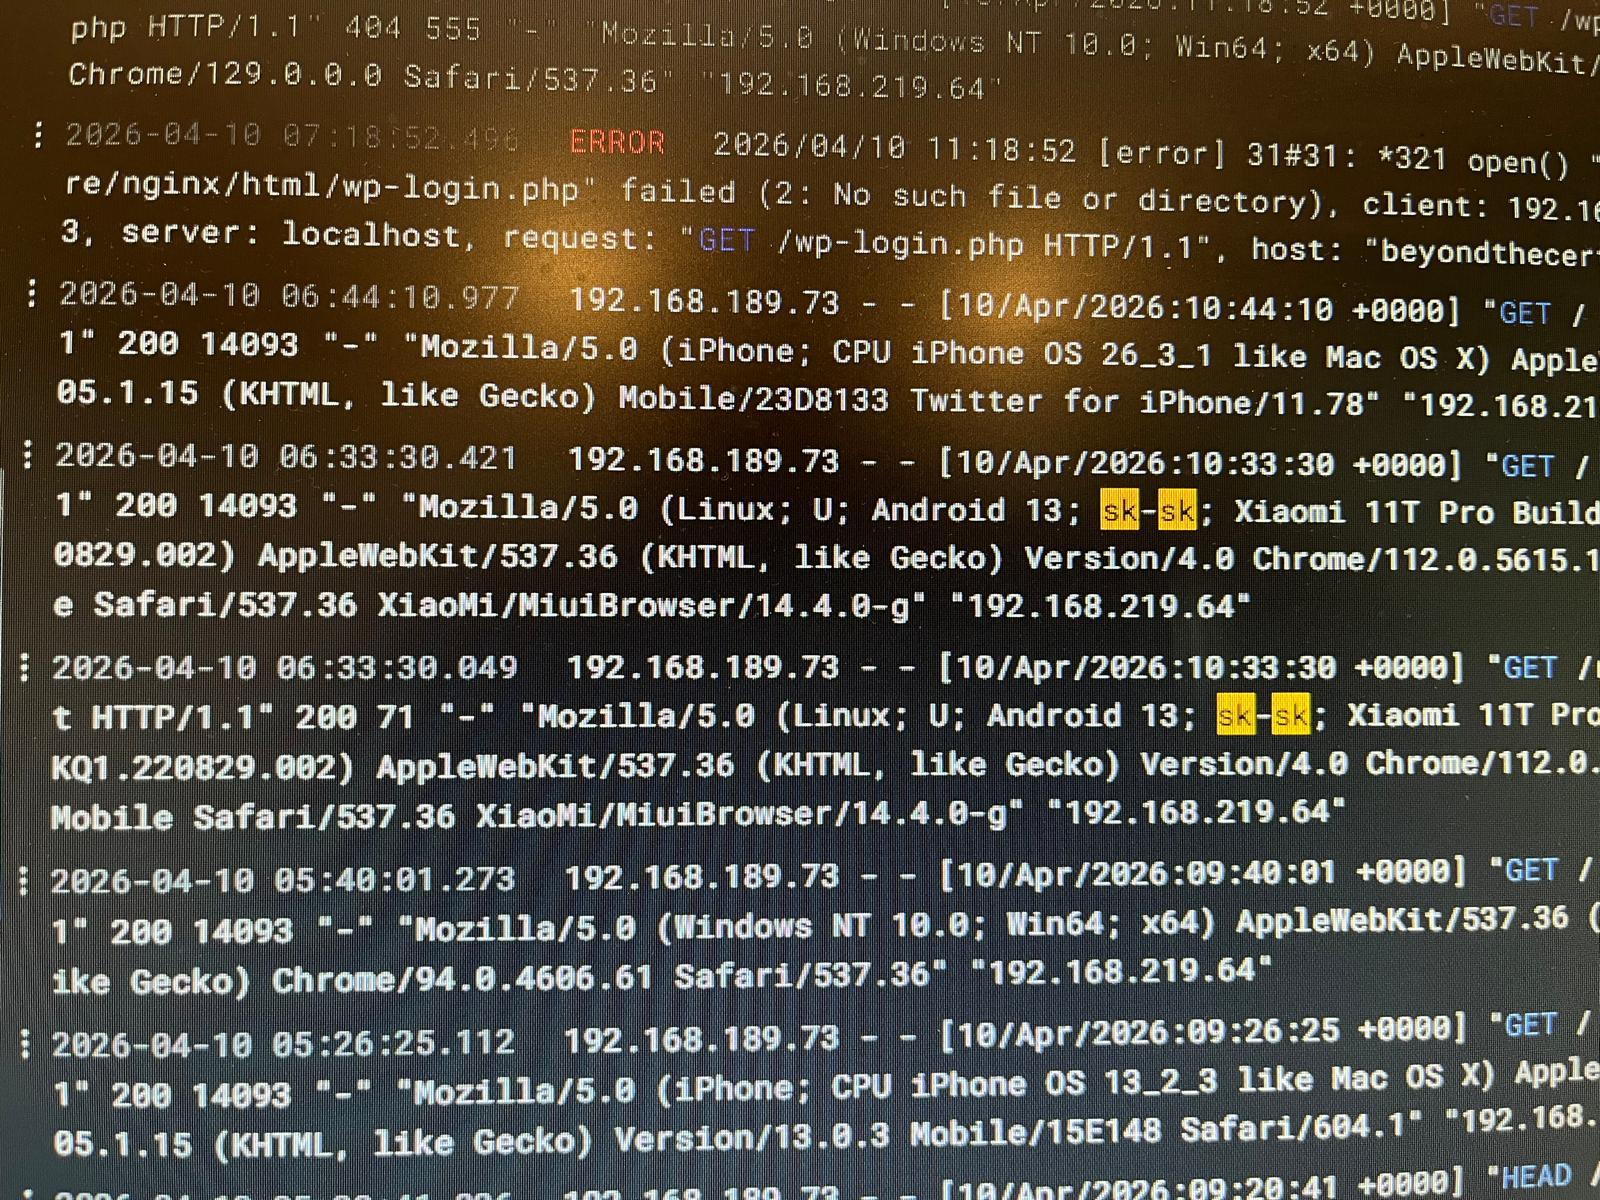 Within the first 24 hours of going live, Loki captured a real visitor from Slovakia browsing the blog.
Within the first 24 hours of going live, Loki — the logging stack running on the cluster — captured a visitor from Slovakia browsing the blog. Real logs. Real visitor. Real cluster. The blog is a portfolio piece. The infrastructure is a portfolio piece. Both prove capability at the same time.
What’s Next I’m treating this cluster like production. The NAS is arriving soon with 8TB of storage for persistent volumes. Immich will run on this cluster to replace Google Photos. This is real infrastructure running real workloads. That’s why I’m already planning Genesis2 — a sandbox cluster where I can break things without consequences. A place to test new CNI plugins. To practice chaos engineering. To prepare for CKS. To experiment with features I won’t touch on Genesis1. The cert gets you in the door. This is what’s behind it. Do it. Be patient. I’m still learning. The work isn’t done.